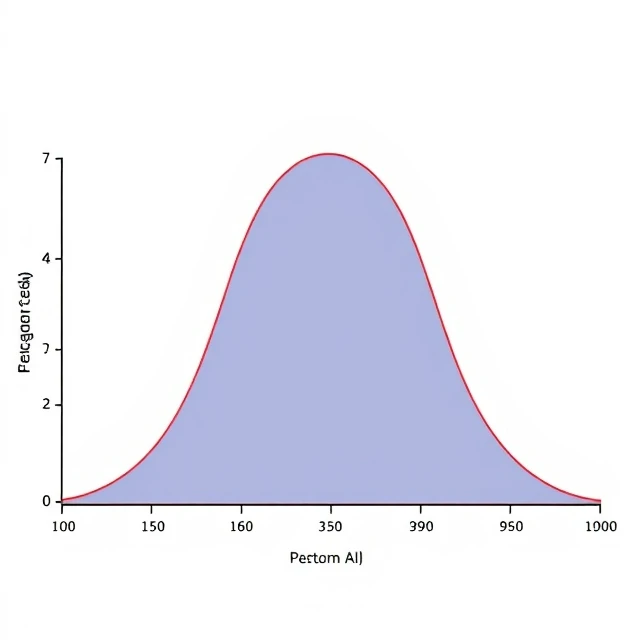
The normal distribution is a continuous probability distribution shaped like a bell. Most values cluster near the mean, and fewer occur as you move away. It is symmetric: the left and right sides mirror each other. The mean, median, and mode all coincide at the center.
Heights, measurement errors, and many natural phenomena follow a normal distribution approximately. The central limit theorem explains why: sums of many independent random variables tend toward normality, regardless of the original distribution.
The distribution is defined by its mean and standard deviation. About 68% of values fall within one standard deviation of the mean, 95% within two, and 99.7% within three. These percentages make the normal distribution useful for quality control, hypothesis testing, and confidence intervals. It is the most important distribution in statistics.
- Bell-shaped, symmetric continuous distribution
- Mean, median, and mode coincide
- Central limit theorem explains its ubiquity
- 68-95-99.7 rule for standard deviations
Comments
No comments yet. Be the first to share a thought.
Leave a comment