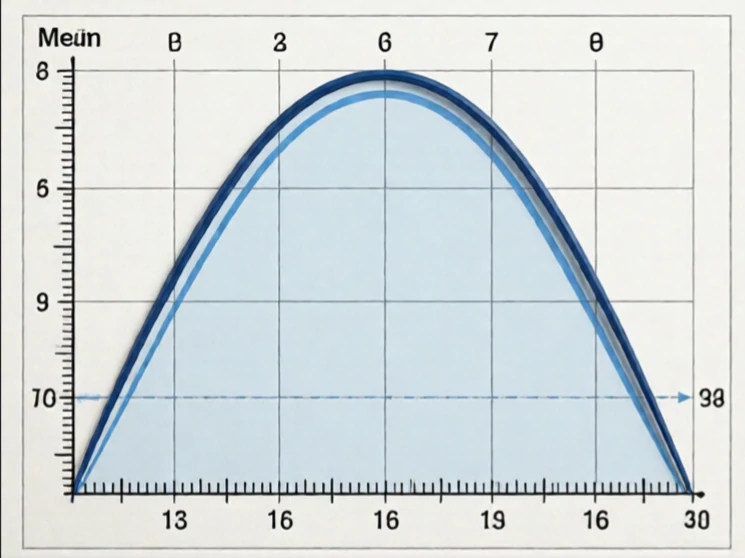
Many measured human traits—height, IQ scores, reaction times—fall into a roughly symmetrical, bell-shaped distribution when plotted for a large population. That shape is the normal curve, also called the Gaussian distribution. Most scores cluster near the mean; fewer appear in the tails.
The curve is fully described by two parameters: the mean and the standard deviation. Roughly 68 percent of scores lie within one standard deviation of the mean, 95 percent within two, and 99.7 percent within three. These percentages allow researchers to convert raw scores into percentiles and to compare individuals across different scales.
Real data only approximate the ideal. Skew and kurtosis appear when samples are small or when the underlying processes are constrained. Still, the normal curve remains a powerful first approximation for many psychological and biological variables.
- Symmetrical bell shape
- Defined by mean and standard deviation
- Known percentages under successive standard deviations
- Useful for standardizing scores
Statistical tests often assume normality; when the assumption fails, alternative methods are required.
Comments
No comments yet. Be the first to share a thought.
Leave a comment