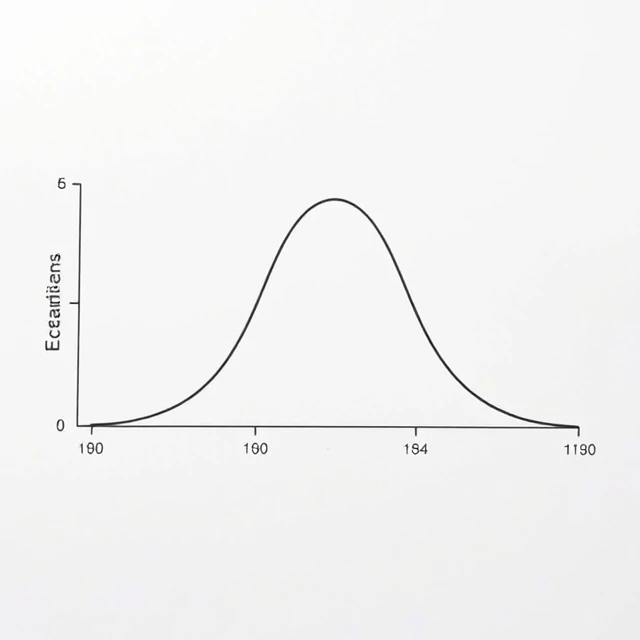
Standard deviation quantifies how spread out the scores in a distribution are around the mean. A small standard deviation means most scores cluster tightly; a large one means they are widely dispersed. The statistic is the square root of the average squared deviation from the mean.
Because it uses the same units as the original data, it is easier to interpret than variance. In a normal distribution, roughly 68 percent of scores fall within one standard deviation of the mean. This property makes the standard deviation central to standardized scoring and to many inferential statistics.
Outliers inflate the value, so researchers sometimes examine the distribution carefully or use robust alternatives. Still, for most psychological and educational data the standard deviation remains the default measure of variability.
- Average distance of scores from the mean
- Expressed in the same units as the data
- Sensitive to extreme scores
- Key parameter of the normal curve
Reporting means without standard deviations leaves the reader unable to judge the consistency of the results.
Comments
No comments yet. Be the first to share a thought.
Leave a comment