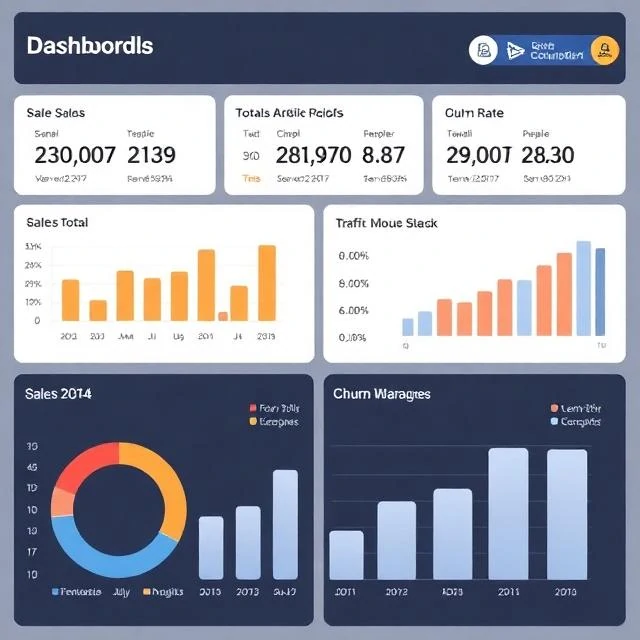
Descriptive analytics answers the question: what happened? It summarizes historical data into reports, dashboards, and metrics. Monthly sales totals. Website traffic by source. Customer churn rate. Average order value. These are the numbers that tell you the current state of the business. Most organizations start here because the questions are straightforward and the data is usually available.
Descriptive analytics is not trivial. Getting the numbers right requires clean data, consistent definitions, and reliable pipelines. A sales report that counts returns differently than the finance system creates confusion. A churn metric that defines churn differently across teams leads to arguments. The work is less about sophisticated modeling and more about discipline. Define metrics once. Document them. Automate the reporting. Update it reliably. The value of descriptive analytics is situational awareness. You cannot manage what you do not measure. But descriptive analytics has limits. It tells you what happened. It does not tell you why. It does not tell you what will happen next. It does not tell you what to do about it. Those questions require diagnostic, predictive, and prescriptive analytics. Descriptive is the foundation. It is not the whole building.
Common descriptive metrics
- Revenue — total sales over a period
- Traffic — visitors, sessions, page views
- Conversion rate — percentage of visitors who take action
- Churn — customers who stop using the product
- Average order value — revenue divided by orders
Descriptive analytics tells you where you are. It does not tell you where to go.
Comments
No comments yet. Be the first to share a thought.
Leave a comment