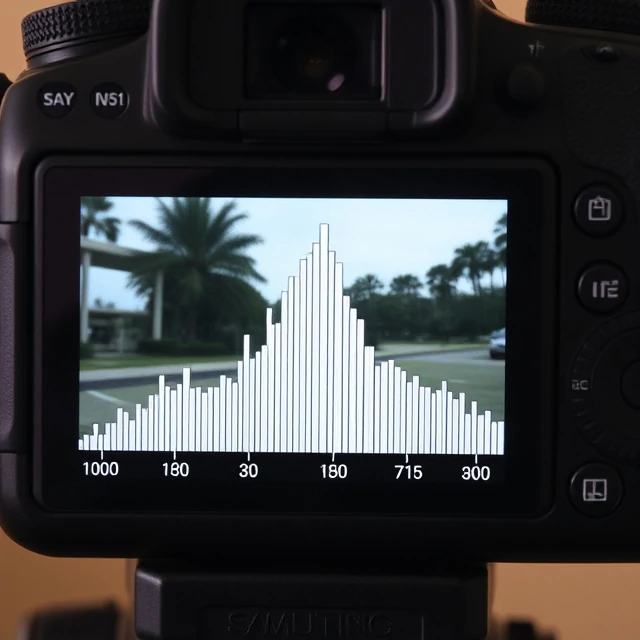
A histogram is a graph that shows the tonal distribution of an image. The horizontal axis runs from black on the left to white on the right. The vertical axis shows how many pixels fall at each brightness level. A histogram that is bunched on the left means the image is dark. One that is bunched on the right means it is bright. One that is spread across the middle means the image has a full range of tones. The histogram is a more reliable guide to exposure than the camera's rear screen, which can be affected by ambient light and screen brightness.
Reading a histogram takes practice. There is no such thing as a perfect histogram. A low-key image will have most pixels on the left. A high-key image will have most pixels on the right. What matters is whether the highlights are clipped, meaning they have gone pure white with no detail, or the shadows are clipped, meaning they have gone pure black. Some clipping is acceptable. Too much is not. The histogram is a tool for judging exposure, not a rule for judging images.
Histogram shapes
- Left-heavy. Dark image, low-key.
- Right-heavy. Bright image, high-key.
- Centered. Balanced tones.
- Clipped. Lost detail in highlights or shadows.
The histogram is not the image. It is a representation of the image's tones. It tells you what the camera recorded, not what the photograph means.
Comments
No comments yet. Be the first to share a thought.
Leave a comment