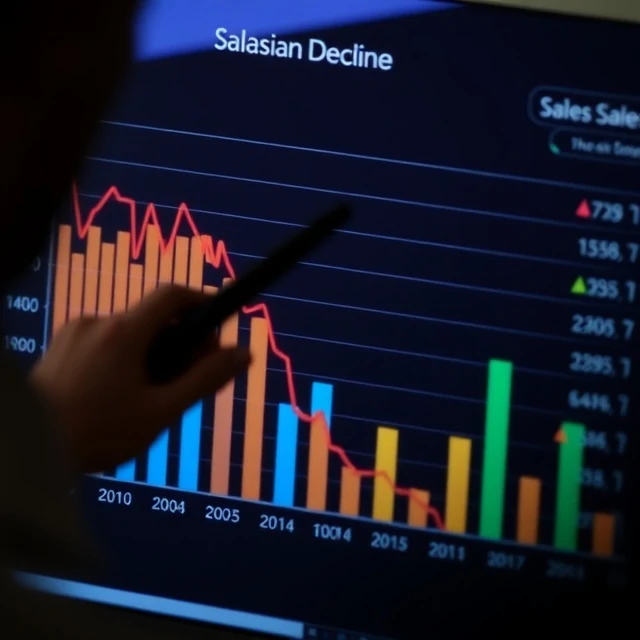
Diagnostic analytics answers the question: why did it happen? Sales dropped last quarter. Why? Website traffic spiked on Tuesday. What caused it? Customer churn increased in the northeast region. What changed? Descriptive analytics shows the what. Diagnostic analytics digs into the why. It uses drill-downs, correlations, and root cause analysis to find explanations.
The techniques vary. Drill-down breaks aggregate numbers into components. The sales drop was concentrated in one product line. The product line decline was concentrated in one region. The region decline started after a competitor launched a promotion. Correlation finds relationships between variables. Churn correlates with support ticket volume. Causation requires more care. A correlation between ice cream sales and drowning deaths does not mean ice cream causes drowning. Both are driven by warm weather. Diagnostic analytics requires domain knowledge to distinguish real causes from spurious ones. It also requires data at the right granularity. If you only have monthly totals, you cannot drill into daily patterns. If you only have regional data, you cannot analyze by store. The questions you can answer depend on the data you collected. Diagnostic analytics often reveals that you need different data than you have.
Diagnostic techniques
- Drill-down — break aggregates into components
- Correlation — find relationships between variables
- Segmentation — compare subgroups
- Root cause analysis — trace effects back to causes
- Anomaly detection — identify unusual patterns
Diagnostic analytics explains the past. The explanation is only as good as the data and the domain knowledge behind it.
Comments (3)
Leave a comment