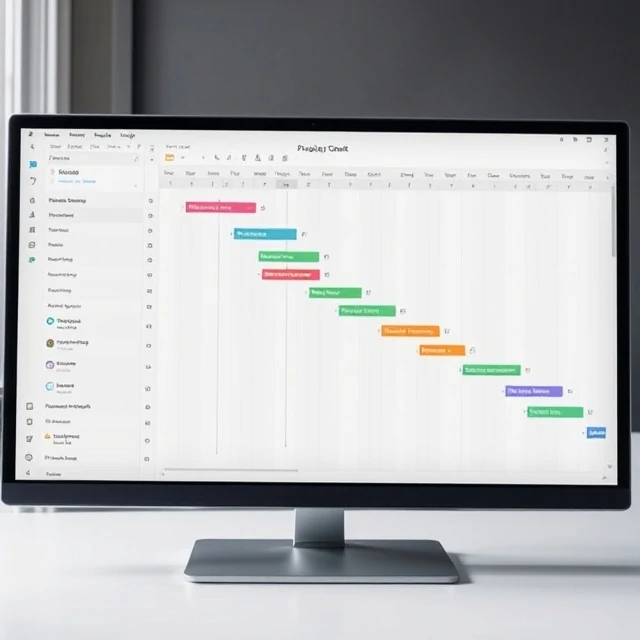
Schedules become visible when drawn against time. A Gantt chart is a bar chart that displays project tasks as horizontal bars positioned along a timeline, showing start dates, durations, and overlaps.
Dependencies, milestones, and progress can be layered onto the basic format. Project managers use Gantt charts to communicate plans, spot resource conflicts, and track whether work is ahead or behind schedule. Software has largely replaced hand-drawn versions, yet the visual logic remains unchanged.
Gantt charts work best when task estimates are realistic and when the chart is updated as reality diverges from plan. Overly detailed charts become unreadable; overly coarse ones hide risk. Used with discipline, they remain one of the most practical planning tools available.
- Bar chart of tasks plotted against time
- Shows duration, sequence, and progress
- Supports planning, communication, and tracking
- Requires realistic estimates and regular updates
Comments
No comments yet. Be the first to share a thought.
Leave a comment