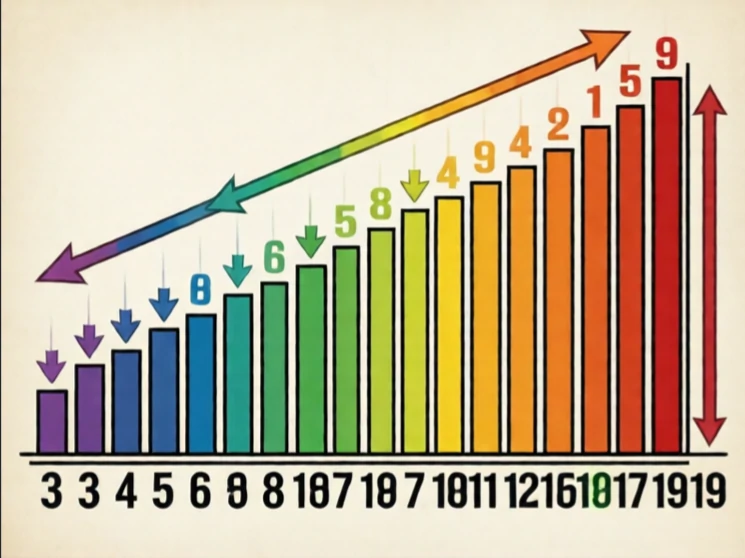
The range is the simplest measure of variability in statistics. It is calculated by subtracting the lowest value in a data set from the highest value. For example, in the set {3, 7, 12, 19}, the range is 19 − 3 = 16.
Because it depends only on the two extreme scores, the range is highly sensitive to outliers and tells us nothing about how the data are distributed between the extremes. Two data sets can have the same range but very different spreads. Despite this limitation, the range is quick to compute and is often used in exploratory analysis, quality control, and reporting daily temperature or stock price fluctuations.
Key points
- Range = highest value − lowest value
- Uses only two scores, so it ignores the middle of the distribution
- Very sensitive to outliers
- Reported in the same units as the original data
Comments
No comments yet. Be the first to share a thought.
Leave a comment