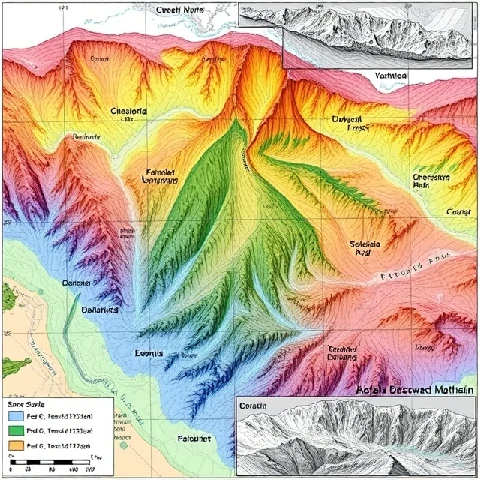
Rock units and structures can be shown on a two-dimensional surface. A geologic map displays the distribution of rock formations, faults, folds, and other geologic features across an area. Colors and patterns conventionally represent different ages or lithologies.
Contacts between units, strike and dip symbols, and fault traces allow a trained reader to visualize the three-dimensional arrangement of rocks. Cross-sections constructed from the map test the consistency of the interpretation. Mapping still begins with fieldwork—walking outcrops, measuring orientations, and collecting samples.
Geologic maps support mineral and petroleum exploration, hazard assessment, land-use planning, and education. Digital GIS versions now allow layering of additional data such as geophysics or geochemistry. A good geologic map remains one of the most information-dense documents a geologist produces.
- Map showing rock units and geologic structures
- Uses colors, patterns, and symbols
- Based on field observation and interpretation
- Essential for resource and hazard evaluation
Comments
No comments yet. Be the first to share a thought.
Leave a comment