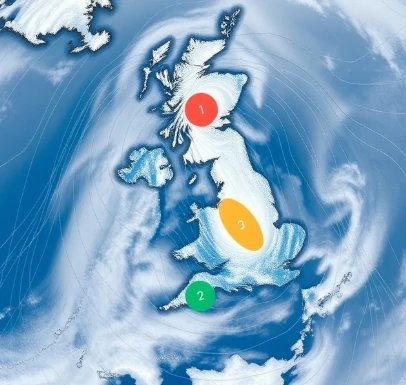
On a weather map, lines that connect points of equal atmospheric pressure are called isobars. They reveal the shape and intensity of high- and low-pressure systems at a glance.
Closely spaced isobars indicate a steep pressure gradient and therefore strong winds. Widely spaced isobars mean light winds. The pattern of closed isobars around a center marks the location of highs and lows. Forecasters use these lines to estimate wind direction and speed and to track the movement of systems.
Isobars are usually drawn at intervals of four millibars. Analysis involves reducing station pressures to sea level so that altitude differences do not distort the patterns. Computer models generate isobars automatically, yet human analysts still refine them for operational use.
- Lines of equal pressure on maps
- Spacing shows wind strength
- Outline highs and lows
- Drawn at standard intervals
Comments
No comments yet. Be the first to share a thought.
Leave a comment