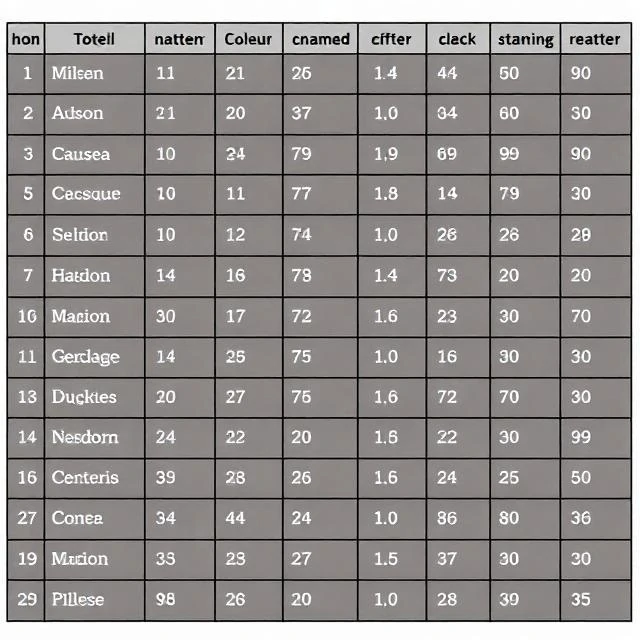
Accuracy hides problems. A confusion matrix exposes them. The table cross-tabulates predicted labels against actual labels, showing exactly where a classifier succeeds and where it fails.
Rows typically represent actual classes and columns represent predictions. The diagonal holds correct classifications. Off-diagonal cells show specific errors, such as benign tumours predicted as malignant. Patterns in those cells guide improvement.
Derived metrics
- Precision, of predicted positives, how many are correct
- Recall, of actual positives, how many were found
- Specificity, true negative rate
- F1 score, harmonic mean of precision and recall
Class imbalance makes the matrix essential. When one class dominates, accuracy looks high while the minority class is ignored. The matrix reveals whether the model is actually learning or simply predicting the majority label.
Comments
No comments yet. Be the first to share a thought.
Leave a comment