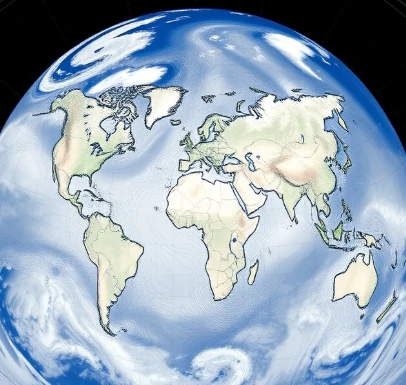
A synoptic chart is a weather map that shows conditions over a large area at a single moment in time. Surface charts typically include pressure patterns, fronts, temperatures, and weather symbols for many stations.
The word synoptic means “viewed together.” By examining the entire pattern, meteorologists can identify the large-scale systems that will shape the weather over the coming days. Sequential charts reveal how those systems are moving and evolving.
Modern synoptic charts are produced by computer from vast observational datasets, yet the principles of analysis remain the same as when charts were drawn by hand. Upper-air synoptic charts show conditions at various pressure levels and are essential for understanding the steering flow.
These charts remain a fundamental tool in operational forecasting centers worldwide.
Comments
No comments yet. Be the first to share a thought.
Leave a comment