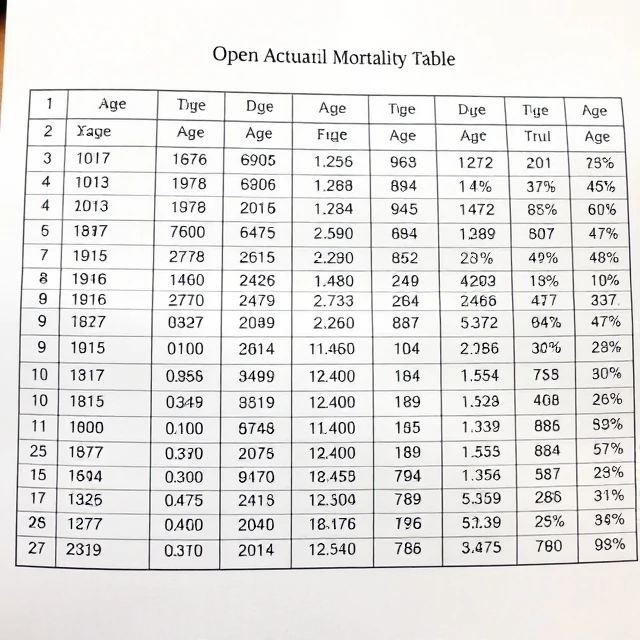
Life insurers once priced policies with rough averages. An actuarial table organizes statistical data on the probability of life events—most commonly death, survival, or disability—by age, sex, and sometimes other factors. These tables convert raw experience into usable rates.
Mortality tables show how many people of a given age are expected to die within a year. Annuity tables project how long payments may continue. Actuaries update the tables as longevity and health patterns shift. Regulators often prescribe specific tables for statutory calculations.
Construction of a reliable table requires large volumes of observed data and careful smoothing to remove random fluctuations. The finished table becomes a foundational tool for pricing life insurance, pensions, and long-term care products. Even small changes in assumed mortality can move billions in reserves.
- Statistical table of life-event probabilities
- Primarily used for mortality and survival rates
- Updated as population experience changes
- Essential input for life insurance pricing
Comments (2)
Leave a comment