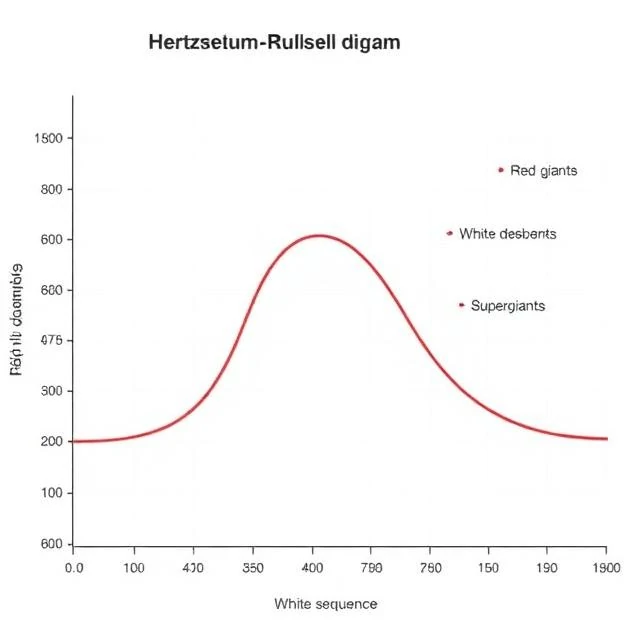
The Hertzsprung-Russell diagram is one of the most important tools in astrophysics. It plots stars by their luminosity on the vertical axis and their temperature or spectral type on the horizontal axis. When astronomers started plotting stars this way in the early 20th century, they found patterns that revealed how stars live and die.
Most stars fall along a diagonal band called the main sequence. These are stars fusing hydrogen into helium in their cores. The Sun is a main-sequence star. Above and to the right are red giants and supergiants, stars that have exhausted their core hydrogen and expanded. Below and to the left are white dwarfs, the cooling remnants of dead stars.
The diagram is also an evolutionary map. A star's position on the diagram tells you its age, mass, and stage of life. As a star evolves, it moves across the diagram in predictable ways. The main sequence is where stars spend most of their lives. The giant branches are where they go when they run out of fuel.
The H-R diagram was independently developed by Ejnar Hertzsprung and Henry Norris Russell around 1910. It remains a foundational tool for understanding stellar populations and the history of galaxies.
Comments (2)
Leave a comment