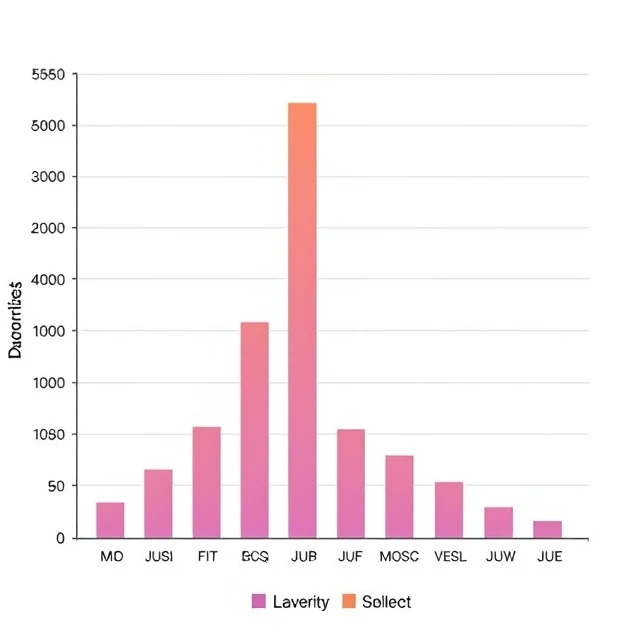
The mode is the value that appears most frequently in a data set. A distribution may have one mode, more than one, or none if all values are unique.
In a set of test scores, the mode identifies the most common score. It is the only measure of central tendency that can be used with nominal data—categories such as favorite color or political affiliation—because it requires only frequency counts. For continuous data the mode is less commonly reported than the mean or median, yet it remains useful when the most typical or popular value is of interest.
Bimodal distributions, with two distinct peaks, can signal the presence of two underlying groups or processes. Examining the mode alongside the mean and median helps reveal the shape of the data. In everyday contexts the mode answers the simple question of which outcome occurred most often.
Counting which number shows up most often yields the mode.
Comments
No comments yet. Be the first to share a thought.
Leave a comment