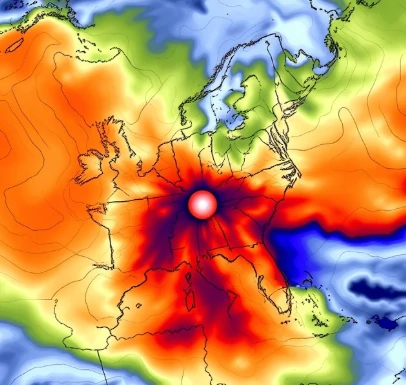
Lines that connect points of equal temperature on a weather map are isotherms. They reveal temperature patterns in the same way isobars reveal pressure patterns.
Tightly packed isotherms mark a sharp temperature gradient, often associated with a front. Broad, widely spaced isotherms indicate more uniform temperatures. On upper-air charts, isotherms help identify the location of the jet stream and the strength of temperature contrasts that fuel storms.
Isotherms are also used in climate maps to show average temperatures for a month or season. In daily forecasting they highlight regions of cold air advection or warming. Drawing accurate isotherms requires careful quality control of temperature observations, especially in complex terrain.
- Lines of equal temperature
- Highlight gradients and fronts
- Used on surface and upper-air maps
- Reveal advection patterns
Comments
No comments yet. Be the first to share a thought.
Leave a comment