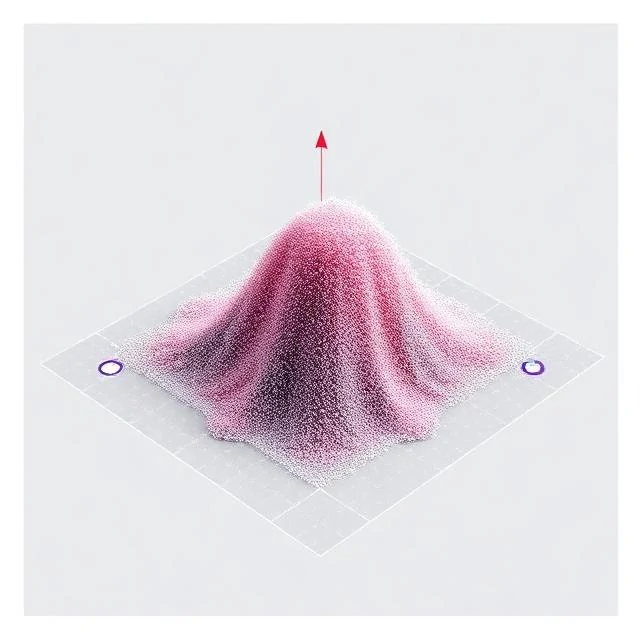
High-dimensional data is hard to visualize, slow to process, and prone to overfitting. Dimensionality reduction compresses features into a smaller set while preserving as much useful structure as possible.
Linear methods like principal component analysis project data onto directions of maximum variance. Nonlinear methods like t-SNE and UMAP preserve local neighbourhoods, which makes them popular for visualizing clusters.
Common techniques
- Principal component analysis
- Linear discriminant analysis
- t-SNE for visualization
- UMAP for manifold learning
- Autoencoders for nonlinear compression
Reduction always loses something. The goal is to drop noise and redundancy while keeping signal. Choosing the right number of dimensions is a judgment call, often guided by downstream performance rather than reconstruction error alone.
Comments
No comments yet. Be the first to share a thought.
Leave a comment